Sodium dodecyl sulfate-polyacrylamide gel electrophoresis (SDS-PAGE) is a widely used technique for separating proteins based on their molecular weight. This method is particularly useful for detecting differentially expressed proteins, which can provide insights into various biological processes and disease states. Below is a comprehensive explanation of the procedures involved in detecting differentially expressed proteins using SDS-PAGE, along with methods for determining their molecular weights.
Step 1: Sample Preparation
1.1 Protein Extraction
- Cell Lysis: Begin by lysing cells to extract proteins. This can be done using lysis buffers containing detergents (e.g., RIPA buffer) that disrupt cell membranes.
- Centrifugation: After lysis, centrifuge the samples at high speed to remove cellular debris. Collect the supernatant, which contains the soluble proteins.
1.2 Protein Quantification
- Use a protein quantification assay (e.g., Bradford assay or BCA assay) to determine the concentration of proteins in your samples. This step ensures that equal amounts of protein are loaded onto the gel.
Step 2: SDS-PAGE Gel Preparation
2.1 Gel Composition
- Prepare a polyacrylamide gel with appropriate concentrations (typically 10-15% acrylamide) depending on the size range of the target proteins.
- The gel consists of two layers: a stacking gel (lower percentage acrylamide) and a separating gel (higher percentage acrylamide).
2.2 Gel Casting
- Pour the separating gel into a casting frame and allow it to polymerize.
- Once polymerized, overlay with buffer solution to prevent drying before adding the stacking gel.
2.3 Stacking Gel Addition
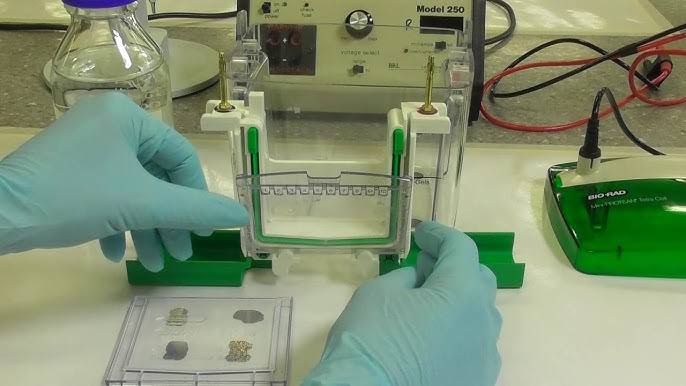
- After polymerization of the separating gel, add the stacking gel on top and insert combs to create wells for sample loading.
Step 3: Sample Loading and Electrophoresis
3.1 Sample Preparation for Loading
- Mix protein samples with SDS loading buffer (containing SDS, reducing agents like DTT or β-mercaptoethanol, and tracking dye).
- Heat samples at 95°C for about 5 minutes to denature proteins completely.
3.2 Loading Samples
- Carefully load equal volumes of prepared samples into wells created in the stacking gel.
3.3 Running the Gel
- Connect the gel apparatus to a power supply and run at constant voltage (typically around 100–150 V). Monitor migration until tracking dye reaches near the bottom of the gel.
Step 4: Protein Visualization
4.1 Staining
- After electrophoresis, stain the gel using Coomassie Brilliant Blue or silver stain to visualize protein bands.
4.2 Imaging
- Use imaging systems or scanners designed for gels to capture images of stained gels.
Step 5: Analysis of Differential Expression
5.1 Band Comparison
- Compare band intensities between different samples (e.g., control vs treatment). Differentially expressed proteins will show significant differences in band intensity or presence/absence.
5.2 Densitometry Analysis
- Use densitometry software to quantify band intensities accurately, allowing statistical analysis of differential expression levels.
Step 6: Determination of Molecular Weight
6.1 Molecular Weight Standards
- Include a molecular weight marker ladder alongside your samples during electrophoresis for reference.
6.2 Estimation from Standard Curve
- After staining and imaging, measure the distance migrated by both your protein bands and standard markers.
6.3 Constructing Standard Curve
- Plot log(molecular weight) against migration distance for standard markers to create a standard curve.
6.4 Calculating Molecular Weight
- Use linear regression from your standard curve equation y = mx + b, where y is log(molecular weight), x is migration distance, and solve for unknowns corresponding to your differentially expressed protein bands.
Conclusion
By following these detailed steps, researchers can effectively detect differentially expressed proteins using SDS-PAGE and accurately determine their molecular weights through comparison with standards.
Detection of differentially expressed proteins in SDS-PAGE involves sample preparation, electrophoresis, visualization through staining, analysis via densitometry, and determination of molecular weight using standard curves derived from molecular weight markers included in each run.


