The human cardiovascular system is a marvel of biological engineering, a tightly regulated pump and pipeline network that ensures vital nutrients and oxygen reach every cell of the body. Central to the assessment of this system are the arterial and venous pulses, palpable and visible manifestations of underlying cardiac events. Understanding their genesis and correlation with the cardiac cycle is fundamental for any healthcare professional, offering invaluable insights into cardiovascular health and disease.
1. The Genesis of Arterial Pulses and Their Cardiac Correlation
Arterial pulses, felt in peripheral arteries like the radial, carotid, or femoral, are the palpable representations of pressure waves propagated through the arterial tree following ventricular ejection. They directly reflect the dynamic interplay between the heart’s pumping action and the elasticity of the arterial walls.
1.1 The Cardiac Event: Ventricular Systole
The genesis of the arterial pulse begins with the rapid contraction of the left ventricle (LV). Once the LV pressure exceeds the aortic pressure, the aortic valve opens, and blood is ejected into the aorta during the ejection phase of ventricular systole. This sudden surge of blood creates a pressure wave that travels much faster than the blood itself, through the highly elastic walls of the arteries.
1.2 The Mechanism of Pulse Propagation
As blood is ejected into the aorta, the aortic root distends. This distension creates a pressure wave that travels distally along the arterial tree, causing sequential expansion and recoil of the arterial walls. This wave is what we perceive as the arterial pulse. The characteristics of this pulse—rate, rhythm, amplitude, contour, and symmetry—provide vital diagnostic clues.
1.3 Components of the Arterial Pulse Waveform (Central Arteries)
While peripheral pulses are complex, the waveform observed in central arteries (like the carotid or femoral) provides a clearer picture of its genesis:
- Anacrotic Limb (Rapid Upstroke): This initial steep rise in pressure corresponds to the rapid ejection of blood from the left ventricle into the aorta after the aortic valve opens. It reflects the rate and force of left ventricular contraction. A slow upstroke can indicate conditions like aortic stenosis, where outflow is obstructed.
- Systolic Peak: This is the highest point of the pulse wave, representing the maximum pressure achieved in the artery during systole. It reflects peak systolic blood pressure.
- Dicrotic Notch (Incisura): This sharp, brief drop in pressure immediately after the systolic peak is caused by the closure of the aortic valve. As the LV begins to relax and its pressure falls below that in the aorta, the backflow of blood causes the aortic valve to snap shut. This momentarily causes a rebound pressure wave that generates the dicrotic notch. It marks the end of ventricular ejection and the beginning of isovolumic relaxation.
- Diastolic Run-off: Following the dicrotic notch, the arterial pressure gradually declines as blood continues to flow from the arteries into the arterioles and capillaries. This decline continues until the next ventricular contraction.
1.4 Relation to the Electrocardiogram (ECG)
The arterial pulse upstroke closely follows the QRS complex on the ECG, which represents ventricular depolarization and the initiation of ventricular contraction. The systolic peak aligns with the later part of the T wave (ventricular repolarization), and the dicrotic notch occurs shortly after the T wave ends.
1.5 Clinical Significance of Arterial Pulse Assessment
Abnormalities in the arterial pulse can signpost a range of cardiovascular conditions:
- Rate and Rhythm: Tachycardia, bradycardia, and irregular rhythms (e.g., atrial fibrillation) directly reflect cardiac electrical activity.
- Amplitude (Strength):
- Pulsus Parvus et Tardus: Small, delayed pulse, characteristic of severe aortic stenosis.
- Bounding Pulse (Water-Hammer Pulse): Large, rapid upstroke, seen in aortic regurgitation, patent ductus arteriosus, or hyperthyroidism, due to rapid ejection and rapid run-off.
- Pulsus Alternans: Alternating strong and weak pulse beats in an otherwise regular rhythm, indicative of severe left ventricular dysfunction.
- Pulsus Paradoxus: Exaggerated inspiratory drop (>10 mmHg) in systolic blood pressure, classically associated with cardiac tamponade, constrictive pericarditis, or severe asthma/COPD.
- Contour: Provides insights into valve function and ventricular contractility.
- Symmetry: Asymmetry can indicate local arterial obstruction (e.g., peripheral artery disease, aortic dissection).
2. The Genesis of Jugular Venous Pulses (JVP) and Their Cardiac Correlation
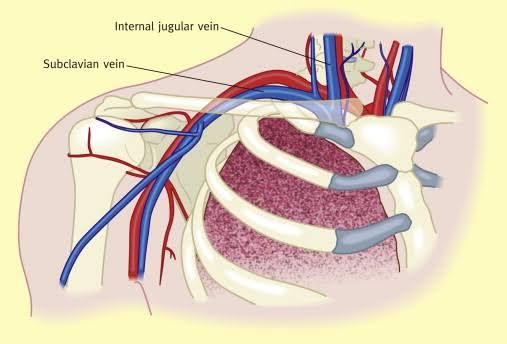
Unlike arterial pulses which are direct reflections of left ventricular ejection, jugular venous pulses are indirect, non-invasive indicators of right atrial pressure (RAP) and, consequently, right ventricular end-diastolic pressure (RVEDP). They are observed in the internal jugular vein (IJV), which has no valves and provides a direct connection to the superior vena cava and right atrium.
2.1 Anatomy and Mechanism
The IJV lies deep to the sternocleidomastoid muscle. Its pulsations are visible but not usually palpable. The JVP reflects pressure changes within the right atrium that are transmitted retrograde up the superior vena cava into the jugular vein. These pressure changes are the result of atrial contraction, ventricular contraction, and passive changes in atrial volume.
2.2 Components of the JVP Waveform
The normal JVP waveform consists of three positive waves (a, c, v) and two descents (x, y), representing specific events within the cardiac cycle of the right heart:
- ‘a’ Wave (Atrial Contraction):
- Genesis: This is the dominant positive wave, caused by the contraction of the right atrium, which pushes a small amount of blood back into the vena cava and jugular veins.
- Cardiac Correlation: Occurs just before the first heart sound (S1) and precedes the carotid pulse. On an ECG, it follows the P wave (atrial depolarization).
- Clinical Significance:
- Prominent ‘a’ wave (Cannon ‘a’ wave): Occurs when the right atrium contracts against a closed tricuspid valve or an obstructed right ventricular outflow (e.g., tricuspid stenosis, right ventricular hypertrophy, pulmonary hypertension, complete heart block where atrium contracts against closed ventricle).
- Absent ‘a’ wave: Seen in atrial fibrillation (no organized atrial contraction).
- ‘c’ Wave (Carotid Artery Pulsation / Tricuspid Valve Bulge):
- Genesis: A small, positive deflection that immediately follows the ‘a’ wave. Traditionally, it was thought to be due to the bulging of the tricuspid valve into the right atrium during the initial phase of right ventricular isovolumic contraction. However, modern understanding suggests it is predominantly an artifact of the adjacent carotid artery pulsation being transmitted to the jugular vein.
- Cardiac Correlation: Occurs during isovolumic ventricular contraction, coinciding with the beginning of the QRS complex on the ECG and coinciding with the carotid pulse.
- Clinical Significance: Usually a minor wave, not typically a primary diagnostic indicator itself, but its relation to the ‘a’ and ‘x’ waves is important.
- ‘x’ Descent (Atrial Relaxation and Atrial Diastole):
- Genesis: A sharp negative deflection following the ‘c’ wave. It represents a combination of two factors:
- Atrial Relaxation: Relaxation of the right atrium after contraction.
- Downward Displacement of Tricuspid Annulus: During right ventricular systole, the tricuspid annulus moves downwards towards the apex, increasing the right atrial volume and thus drawing blood from the great veins, causing pressure to fall.
- Cardiac Correlation: Occurs during ventricular systole, before the T wave on the ECG.
- Clinical Significance:
- Blunted or Absent ‘x’ descent: Can indicate right atrial dilation or tricuspid regurgitation (where the ‘v’ wave becomes very prominent and merges with the ‘c’ wave, forming a ‘c-v’ wave).
- Prominent ‘x’ descent: Seen in cardiac tamponade (where the y descent is blunted, creating a prominent x descent).
- Genesis: A sharp negative deflection following the ‘c’ wave. It represents a combination of two factors:
- ‘v’ Wave (Ventricular Systole and Right Atrial Filling):
- Genesis: A positive wave occurring during ventricular systole when the tricuspid valve is closed. It reflects the passive filling of the right atrium by venous return from the superior and inferior vena cava. As blood flows into the closed right atrium, pressure gradually builds.
- Cardiac Correlation: Occurs during ventricular systole, typically peaking after the T wave on the ECG.
- Clinical Significance:
- Prominent ‘v’ wave: Most commonly due to tricuspid regurgitation (blood flowing retrograde into the right atrium during systole, massively increasing atrial volume and pressure).
- Large ‘c-v’ wave: A prominent ‘v’ wave that merges with the ‘c’ wave, pathognomonic for severe tricuspid regurgitation.
- ‘y’ Descent (Rapid Ventricular Filling):
- Genesis: A sharp negative deflection following the ‘v’ wave. It represents the rapid emptying of the right atrium into the right ventricle after the opening of the tricuspid valve at the beginning of ventricular diastole.
- Cardiac Correlation: Occurs during early ventricular diastole, coinciding with the opening of the tricuspid valve and the early rapid filling phase of the right ventricle.
- Clinical Significance:
- Blunted or Absent ‘y’ descent: Seen in conditions obstructing right ventricular filling, such as tricuspid stenosis or cardiac tamponade (where the heart is constricted by fluid).
- Prominent/Steep ‘y’ descent (“W” or “M” pattern): Characteristic of constrictive pericarditis, where rapid early diastolic filling is abruptly halted by the rigid pericardium.
3. The Value of Central Venous Pressure (CVP) Measurement
While JVP is a qualitative assessment of right atrial pressure, Central Venous Pressure (CVP) offers a quantitative, direct measurement.
3.1 Definition and Methodology
CVP is the pressure of blood in the superior vena cava, near the right atrium, reflecting the right atrial pressure. It is typically measured by inserting a central venous catheter (usually into the internal jugular, subclavian, or femoral vein) and advancing its tip into the superior vena cava, just above the right atrium. The catheter is then connected to a transducer, which converts the pressure waves into an electrical signal displayed on a monitor.
3.2 Normal Values
Normal CVP values typically range from 2 to 6 mmHg (or 3 to 8 cmH₂O).
3.3 Clinical Significance and Diagnostic Value of CVP
CVP measurement is a crucial hemodynamic parameter in the management of critically ill patients, providing insights into:
- Right Ventricular Preload: CVP is often used as a surrogate for right ventricular end-diastolic volume (RVEDV), which is a key determinant of preload. In basic terms, a higher CVP suggests higher right atrial and right ventricular filling pressures.
- Fluid Status Assessment:
- Low CVP (<2 mmHg): Often indicates hypovolemia (e.g., dehydration, hemorrhage), suggesting a need for fluid resuscitation.
- High CVP (>6 mmHg): Can indicate hypervolemia (fluid overload), right ventricular failure, tricuspid valve disease, pulmonary hypertension, or cardiac tamponade. It suggests decreased right ventricular compliance or increased resistance to right ventricular emptying.
- Guiding Fluid Management: CVP is frequently used to guide fluid resuscitation in conditions like shock (septic, hypovolemic), severe burns, or major surgery. While not perfect, a trend in CVP, especially in conjunction with other clinical parameters, helps to determine the adequacy of fluid replacement and prevent over-resuscitation.
- Cardiac Function Assessment:
- Elevated CVP in Heart Failure: In right-sided heart failure, the right ventricle struggles to efficiently pump blood forward, leading to blood backing up into the right atrium and venous system, thus elevating CVP.
- Elevated CVP in Pulmonary Hypertension: Increased pressure in the pulmonary arteries can increase the workload on the right ventricle, eventually leading to right ventricular dysfunction and elevated CVP.
- Monitoring Response to Therapy: Changes in CVP can indicate the effectiveness of interventions, such as diuretics (expected to lower CVP in fluid overload) or inotropic agents (which may improve cardiac output and normalize filling pressures).
- Diagnosis of Specific Conditions:
- Cardiac Tamponade: Characterized by elevated CVP, often with equalisation of diastolic pressures, and a blunted ‘y’ descent on the CVP waveform (confirming the JVP finding).
- Constrictive Pericarditis: Shows elevated CVP with prominent ‘x’ and ‘y’ descents (“square root sign” or “M” pattern), reflecting rapid early filling abruptly halted by the rigid pericardium.
3.4 Limitations of CVP Measurement
Despite its utility, CVP has limitations:
- Not a direct measure of LV Preload: CVP reflects right-sided pressures. While it correlates with left ventricular preload in patients with healthy lungs and left heart, this correlation breaks down in conditions like severe lung disease (e.g., ARDS) or left ventricular dysfunction. Pulmonary Capillary Wedge Pressure (PCWP) is a better indicator of left heart filling.
- Influenced by Thoracic Pressure: Mechanical ventilation, positive end-expiratory pressure (PEEP), and conditions like pneumothorax can artificially elevate CVP readings by increasing intrathoracic pressure.
- Patient Position: Accurate CVP measurement requires a consistent reference point and patient positioning (e.g., supine with the transducer at the level of the right atrium).
- Static vs. Dynamic Measurements: A single CVP value provides less information than trends over time or dynamic measurements (e.g., CVP response to a fluid challenge).
Conclusion
The arterial and jugular venous pulses, though seemingly simple observations, are profound indicators of complex cardiovascular physiology. The arterial pulse provides a direct window into left ventricular ejection and systemic arterial health, while the jugular venous pulse offers a non-invasive, yet detailed, insight into right atrial pressure dynamics and right heart function. Central venous pressure measurement complements JVP by offering a quantifiable, continuous assessment of right heart preload and systemic fluid status. A comprehensive understanding of their genesis, waveform characteristics, and clinical implications is indispensable for accurate cardiovascular assessment, enabling clinicians to diagnose disease, monitor progression, and guide therapeutic interventions, ultimately enhancing patient care.

