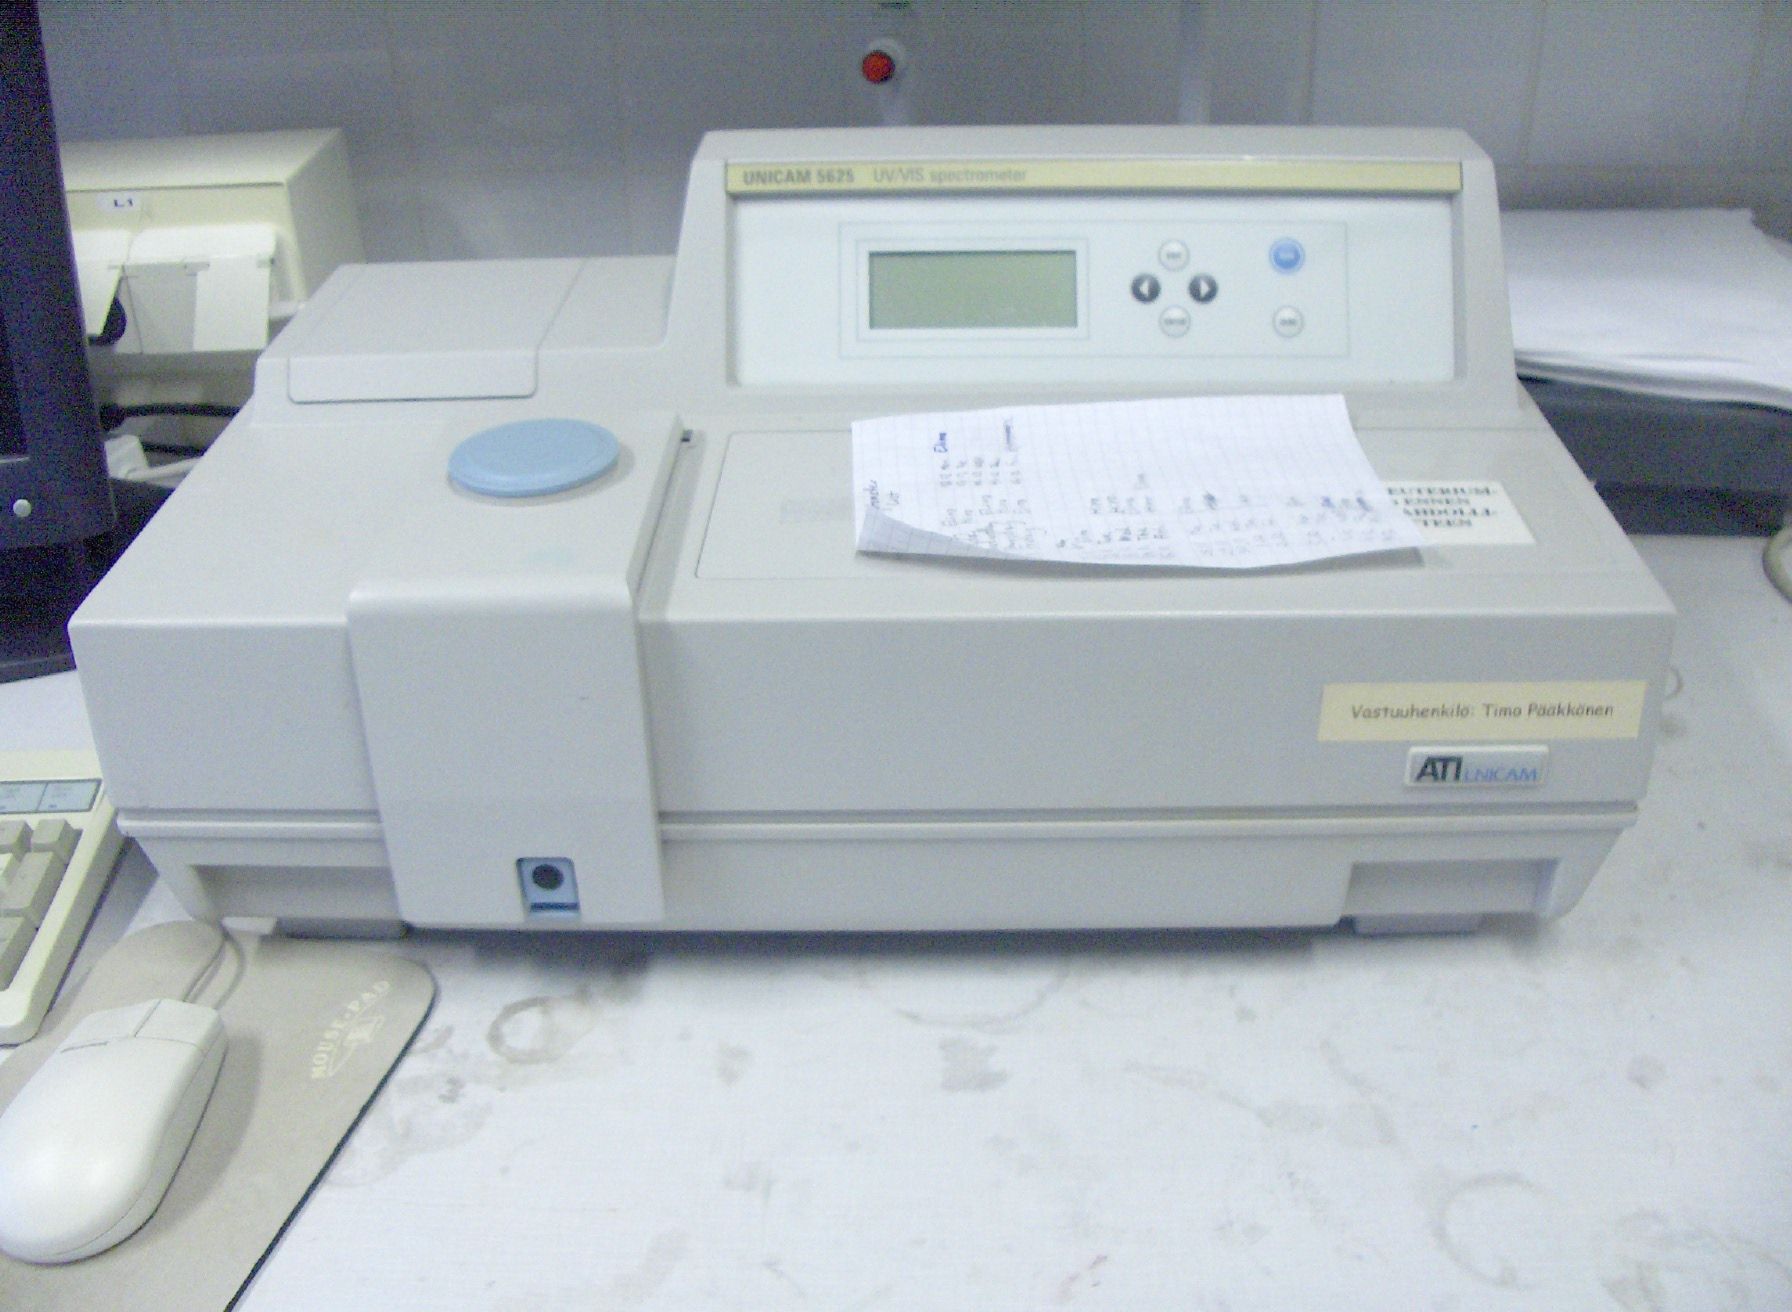
Spectrophotometry stands as a cornerstone analytical technique across virtually all scientific disciplines, offering a versatile and precise method for both quantitative and, to some extent, qualitative analysis of substances. At its heart, spectrophotometry involves the measurement of the interaction between electromagnetic radiation (specifically light) and matter. By quantifying how much light a substance absorbs, transmits, or reflects at different wavelengths, scientists can deduce critical information about its concentration, identity, and even its molecular structure.
1. Introduction to Spectrophotometry: Unveiling the Light-Matter Interaction
Spectrophotometry is defined as the quantitative measurement of the reflection or transmission properties of a material as a function of wavelength. It relies on the fundamental principle that every chemical compound absorbs, transmits, or reflects light (electromagnetic radiation) over a certain range of wavelengths. The amount of light absorbed is directly proportional to the concentration of the substance and the path length the light travels through the sample.
The Electromagnetic Spectrum: Light is a form of electromagnetic radiation, encompassing a broad spectrum of wavelengths, from gamma rays to radio waves. Spectrophotometry typically focuses on the ultraviolet (UV) region (190-400 nm), the visible (Vis) region (400-700 nm), and sometimes the near-infrared (NIR) region (700-2500 nm). Substances interact differently with light at various wavelengths. For instance, colored solutions absorb specific visible wavelengths and transmit or reflect others, giving them their characteristic color. Colorless solutions may absorb in the UV region.
Key Concepts and the Beer-Lambert Law: The interaction of light with a sample can be described by two primary phenomena:
- Absorption: When light passes through a sample, some of its energy is absorbed by the molecules, causing them to transition to a higher energy state.
- Transmission: The portion of light that passes through the sample without being absorbed.
The relationship between light absorption and concentration is mathematically defined by the Beer-Lambert Law, a fundamental principle in spectrophotometry. It states that the absorbance of a solution is directly proportional to the concentration of the absorbing species and the path length of the light through the solution. The law is expressed as:
A = εbc
Where:
- A is the absorbance (dimensionless).
- ε (epsilon) is the molar absorptivity (or molar extinction coefficient), a constant specific to the absorbing substance at a given wavelength (L mol⁻¹ cm⁻¹).
- b is the path length of the light through the sample (typically 1 cm in standard cuvettes).
- c is the concentration of the absorbing substance (mol L⁻¹).
A spectrophotometer works by shining a beam of monochromatic light (light of a single wavelength) through a sample and measuring the amount of light that passes through it. The instrument then calculates the absorbance of the sample.
Components of a Spectrophotometer: A basic spectrophotometer consists of several key components working in sequence:
- Light Source: Emits a broad spectrum of light. Common sources include deuterium lamps for UV light and tungsten-halogen lamps for visible and near-infrared light.
- Monochromator: Selects a specific wavelength (or a narrow band of wavelengths) from the light source and blocks others. This is typically a diffraction grating or prism.
- Sample Holder: A transparent cuvette (usually made of quartz for UV, glass or plastic for Vis) holds the sample.
- Detector: Measures the intensity of the light that passes through the sample. Common detectors include photodiodes or photomultiplier tubes, which convert light energy into an electrical signal.
- Digital Display/Processor: Processes the detector’s signal, calculates absorbance or transmittance, and displays the results.
The operation generally involves calibrating the instrument with a “blank” (a solution containing all components except the analyte) to zero out any background absorption, then measuring the sample.
2. Significance of Spectrophotometry: A Foundational Analytical Tool
Spectrophotometry’s significance stems from its exceptional versatility, reliability, and cost-effectiveness, making it an indispensable tool across a vast array of scientific and industrial applications. Its advantages include:
- Quantitative Accuracy and Precision: By adhering to the Beer-Lambert Law, spectrophotometry allows for highly accurate and precise determination of analyte concentrations, often with detection limits in the picomolar to micromolar range. This quantitative power is critical for research, quality control, and clinical diagnostics.
- Versatility: The technique is applicable to a wide range of substances, including organic molecules (proteins, nucleic acids, drugs), inorganic ions (metals, phosphates), and even macroscopic entities like bacterial cells (by measuring turbidity). Many non-absorbing substances can be analyzed after conversion into an absorbing derivative through a colorimetric reaction.
- Non-Destructive Analysis: In many cases, the sample remains unaltered after analysis, allowing for further experimentation or recovery of valuable materials. This is particularly important for precious biological samples.
- Speed and Efficiency: Spectrophotometric measurements are typically very rapid, often taking only seconds per sample. This makes it ideal for high-throughput screening and monitoring dynamic processes in real-time. Automated systems further enhance efficiency.
- Cost-Effectiveness: Compared to many other sophisticated analytical techniques, spectrophotometers are relatively affordable to purchase and operate. The consumables (cuvettes, reagents) are also generally inexpensive. Its widespread availability makes it a standard instrument in almost every laboratory.
- Ease of Use: Modern spectrophotometers are user-friendly, requiring minimal training for routine operation. Software interfaces guide users through calibration and measurement processes, reducing the potential for error.
- Qualitative Information: While primarily quantitative, spectrophotometry can offer qualitative insights. The unique absorption spectrum (a plot of absorbance vs. wavelength) of a pure substance acts as a “fingerprint,” which can aid in identification or purity assessment by comparing it to known spectra. Shifts in peak wavelengths or changes in peak intensity can also indicate molecular interactions or chemical reactions.
- Monitoring Chemical Reactions: The change in absorbance over time can be used to track reaction kinetics, enzyme activity, and the formation or degradation of products, providing vital information about reaction mechanisms and rates.
These attributes collectively establish spectrophotometry as a foundational analytical technique essential for research, development, and routine analysis in countless fields.
3. Applications of Spectrophotometry: Bridging Disciplines
The broad utility of spectrophotometry makes it invaluable in an extensive range of fields, from fundamental scientific research to industrial quality control and clinical diagnostics.
3.1. Biochemistry and Molecular Biology:
- Nucleic Acid Quantification: DNA and RNA absorb strongly at 260 nm (A260) due to their nitrogenous bases. Spectrophotometry is routinely used to determine the concentration of purified DNA or RNA samples. The purity is assessed by the A260/A280 ratio, where a ratio of ~1.8-2.0 indicates pure DNA/RNA, while lower ratios suggest protein contamination (proteins absorb at 280 nm due to aromatic amino acids like tryptophan and tyrosine).
- Protein Concentration Determination: Several colorimetric assays leverage spectrophotometry for protein quantification:
- Bradford Assay: Coomassie Brilliant Blue G-250 dye binds to basic and aromatic amino acid residues in proteins, causing a shift in the dye’s absorbance maximum from 465 nm to 595 nm. Higher absorbance at 595 nm correlates with higher protein concentration.
- Bicinchoninic Acid (BCA) Assay: Proteins reduce Cu²⁺ to Cu⁺ in alkaline conditions, and BCA then chelates with Cu⁺ to produce a purple product that absorbs at 562 nm.
- Lowry Assay: Similar to BCA, it involves copper reduction, followed by oxidation of aromatic protein residues by Folin-Ciocalteu reagent, generating a blue color.
- Enzyme Kinetics: By monitoring the rate of appearance of a colored product or disappearance of a colored substrate over time, enzyme activity can be precisely quantified. For example, NADH and NADPH absorb at 340 nm, while NAD⁺ and NADP⁺ do not. Changes in absorbance at 340 nm are often used to follow reactions involving these cofactors.
- Cell Density Measurement (Turbidity): Microbial cell cultures (e.g., bacteria, yeast) are often measured at 600 nm (OD600) to estimate cell density. As cell numbers increase, light scattering increases, and transmitted light decreases, indicating higher turbidity.
3.2. Analytical Chemistry:
- Concentration Determination: Spectrophotometry is the primary method for determining the concentration of unknown solutions by generating a standard curve (plotting absorbance vs. known concentrations) and then interpolating the absorbance of the unknown.
- Reaction Monitoring: Tracking the progress of chemical reactions by observing changes in absorbance of reactants or products over time.
- Purity Assessment: Identifying impurities in a compound if they have distinct absorption characteristics.
3.3. Environmental Science:
- Water Quality Analysis: Spectrophotometry is extensively used to quantify pollutants in water samples. For instance, colorimetric methods are employed to detect and measure heavy metals (e.g., lead, cadmium), nitrates, phosphates, ammonia, chlorine, and organic pollutants, often after specific chemical reactions produce colored complexes.
- Air Quality Monitoring: Analyzing specific gaseous pollutants after they have been collected and reacted to form light-absorbing compounds.
3.4. Food and Beverage Industry:
- Quality Control: Determining the color of juices, beers, wines, and other food products, which is crucial for consumer acceptance and regulatory compliance.
- Nutrient Analysis: Quantifying vitamins (e.g., Vitamin A), sugars, proteins, and minerals.
- Detection of Adulteration: Identifying contaminants or fraudulent ingredients by their distinct spectral profiles.
3.5. Pharmaceutical Industry:
- Drug Substance Concentration: Precisely measuring the concentration of active pharmaceutical ingredients (APIs) in raw materials and finished drug products.
- Dissolution Testing: Monitoring the release rate of active ingredients from tablets or capsules by measuring the concentration of dissolved drug in a dissolution medium over time.
- Stability Studies: Assessing the degradation of drugs over time under various storage conditions.
- Purity and Impurity Profiling: Ensuring the purity of pharmaceutical compounds and quantifying known impurities.
3.6. Clinical Diagnostics:
- Blood Chemistry: Automated clinical analyzers frequently utilize spectrophotometric principles to measure a wide range of analytes in blood and other body fluids, including glucose, cholesterol, triglycerides, bilirubin, creatinine, urea, and various enzymes (e.g., AST, ALT).
- Urinalysis: Detecting abnormal components in urine, often via colorimetric strips read by spectrophotometers.
3.7. Material Science and Manufacturing:
- Color Matching: In industries such as paint, textiles, and plastics, spectrophotometers are used to ensure consistent color production and to match colors accurately.
- Optical Properties: Characterizing the optical properties of materials, including thin films and coatings.
Conclusion
Spectrophotometry is a highly versatile, reliable, and fundamental analytical technique that leverages the interaction of light with matter to provide quantitative and qualitative information about samples. From elucidating molecular structures in biochemistry to ensuring product quality in industry and diagnosing diseases in clinical settings, its applications are incredibly diverse and continually expanding. The adherence to the Beer-Lambert Law, coupled with its accuracy, speed, and cost-effectiveness, solidify its position as an indispensable tool across the scientific and technological landscape, driving discovery, ensuring safety, and facilitating control in myriad domains.
References
- Skoog, D. A., Holler, F. J., & Crouch, S. R. (2017). Principles of Instrumental Analysis. Cengage Learning.
- Harris, D. C., & Lucy, C. A. (2020). Quantitative Chemical Analysis. W. H. Freeman.
- Garrett, R. H., & Grisham, C. M. (2016). Biochemistry. Cengage Learning.
- Lodish, H., Berk, A., Kaiser, C. A., Krieger, M., Bretscher, A., Ploegh, H., & Amon, A. (2016). Molecular Cell Biology. W. H. Freeman.
- Molecular Devices. (n.d.). Spectrophotometry Fundamentals. Retrieved from https://www.moleculardevices.com/applications/spectrophotometry-fundamentals (Accessed October 26, 2023).


