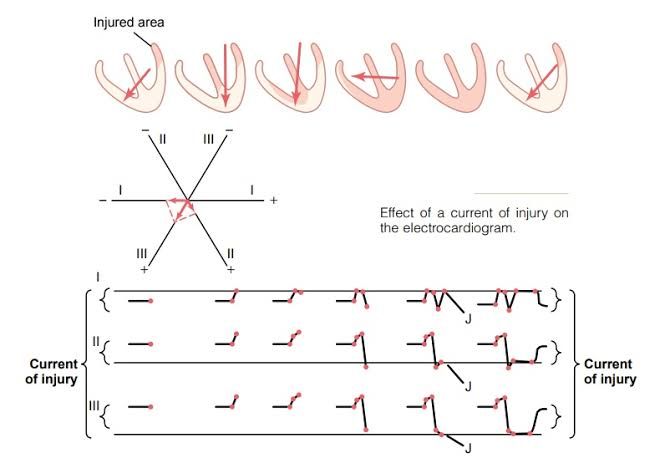
The electrocardiogram (ECG) is an indispensable tool in the diagnosis and management of acute coronary syndromes (ACS), including myocardial ischemia, injury, and infarction (death of heart muscle). Understanding the characteristic ECG changes associated with each of these processes is crucial for timely and effective clinical intervention.
Understanding the Electrical Basis of the ECG
Before examining the pathological changes, it is essential to recall the fundamental electrical activity of the heart that the ECG records. The heart’s electrical system, originating in the sinoatrial (SA) node, generates electrical impulses that spread through the atria and ventricles via specialized conducting tissues. This electrical depolarization and repolarization of cardiac cells create measurable electrical currents that are detected by electrodes placed on the body’s surface.
The ECG waveform is composed of distinct components:
- P wave: Represents atrial depolarization, the electrical activation of the atria.
- QRS complex: Represents ventricular depolarization, the electrical activation of the ventricles.
- T wave: Represents ventricular repolarization, the electrical recovery of the ventricles.
- ST segment: The isoelectric (flat) line between the end of the QRS complex and the beginning of the T wave. It represents the period when the ventricles are fully depolarized and before repolarization begins.
- QT interval: The duration from the beginning of ventricular depolarization to the end of ventricular repolarization.
Myocardial Ischemia: The Warning Signs
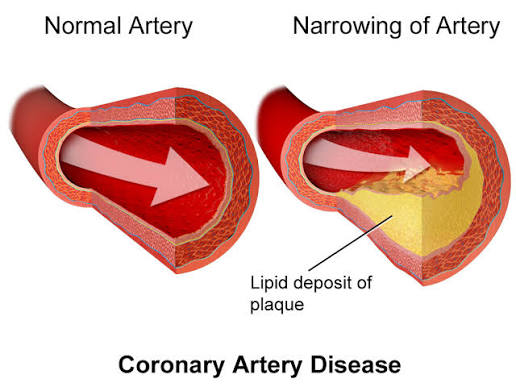
Myocardial ischemia occurs when the heart muscle does not receive an adequate supply of oxygenated blood, typically due to a narrowing or blockage in the coronary arteries. While severe ischemia can lead to infarction, milder or transient forms can manifest with specific, often reversible, ECG changes.
The hallmark ECG abnormality of myocardial ischemia is ST segment depression. This typically appears as a downward sloping or horizontal depression of the ST segment relative to the isoelectric baseline. The magnitude of depression can vary, but generally, 1 mm (0.1 mV) or more in at least two contiguous ECG leads is considered significant.
Mechanism of ST Segment Depression in Ischemia:
In ischemic myocardial cells, there is a disruption in normal ion flux and cellular function. This leads to a decrease in the resting membrane potential of these cells. When the ischemic area attempts to repolarize, it does so more slowly and perhaps incompletely compared to healthy tissue. During ventricular depolarization (QRS complex), the ischemic area is either depolarized or is in the process of repolarizing differently. As the ventricles reach complete depolarization, the ischemic cells cannot maintain their normal polarized state. This creates a current of injury that flows from the non-ischemic (electrically healthy) myocardium to the ischemic (electrically dysfunctional) myocardium during the ST segment period, when the ventricles should be plateaued and electrically stable. This outward current flow from the exploring electrode placed over the ischemic area causes the ST segment to dip below the baseline.
Another common ECG finding in ischemia is T wave inversion. The T wave represents ventricular repolarization. In ischemic conditions, repolarization is altered, leading to an inverted (upside down) T wave. T wave inversion can be subtle or pronounced and is often seen in conjunction with ST segment depression.
Other ECG changes that may be seen in myocardial ischemia include:
- Peaked or symmetrical T waves: In early or evolving ischemia, T waves may initially become tall and peaked before progressing to inversion.
- U waves: A small, often positive deflection following the T wave, the U wave’s presence can be accentuated in conditions of hypokalemia, which can be exacerbated by myocardial ischemia.
- Arrhythmias: Ischemia can disrupt the heart’s electrical conduction system, leading to various arrhythmias such as premature atrial contractions (PACs), premature ventricular contractions (PVCs), and conduction blocks.
It is crucial to remember that ECG changes in ischemia are often dynamic and can revert to normal if blood flow is restored quickly.
Myocardial Injury: The Active Threat
Myocardial injury refers to a more severe and prolonged state of ischemia where the cardiac cells are irreversibly damaged but not yet completely dead. This stage is characterized by more pronounced and persistent ECG abnormalities.
The prominent ECG finding of myocardial injury is ST segment elevation. This is defined as an elevation of the ST segment above the isoelectric baseline by 1 mm (0.1 mV) or more in at least two contiguous ECG leads. The shape of the ST segment elevation is also significant:
- Concave (“smiley face”) ST elevation: Often seen in pericarditis, but can also occur in early transmural ischemia.
- Convex (“domed”) ST elevation: Classically associated with acute transmural myocardial infarction.
Defining Injury Current and its Effect on the ST Segment:
The concept of “injury current” is central to understanding ST segment elevation and depression. An injury current is an electrical current that flows between cells with normal membrane potentials and cells with abnormal (depolarized or damaged) membrane potentials. This occurs when there is a difference in the electrical state between adjacent areas of the myocardium.
During the ST segment period, normally polarized myocardial cells have a positive charge outside and a negative charge inside. Damaged or injured cells have a reduced resting membrane potential, meaning they are more depolarized. This difference in electrical potential creates a current that flows from the healthy, uninjured, and therefore more negative intracellularly (more positive extracellularly) towards the injured, depolarized region (more positive intracellularly or less negative extracellularly).
How Injury Current Alters the ST Segment:
- ST Segment Depression: When the exploring electrode is placed over the ischemic or injured area, the outward flow of the injury current from the healthy tissue towards the injured area causes a relative negativity at the exploring electrode. This results in a depression of the ST segment.
- ST Segment Elevation: Conversely, when the exploring electrode is placed over healthy, uninjured myocardium that is electrically remote from the injured region, the current of injury flows away from this electrode. This outward flow of current from the electrode site creates a relative positivity, leading to an elevation of the ST segment. This is the classic ECG manifestation of transmural myocardial injury or infarction.
Therefore, ST segment elevation signifies that the injury current is flowing away from the exploring electrode placed over healthy tissue, indicating that the primary injury is occurring in another region of the heart. Conversely, ST segment depression suggests the electrode is placed over the injured region, and the injury current is flowing towards it.
Other ECG changes associated with myocardial injury include:
- Hyperacute T waves: Early in transmural injury, T waves may become tall and peaked, with a narrow base. This often precedes ST segment elevation.
- Reciprocal ST segment depression: In leads that are electrically opposite to the area of injury, reciprocal ST segment depression (mirror image of elevation) may be observed. This is a crucial diagnostic clue.
- Development of Q waves: As infarction progresses and myocardial cells die, the injured area becomes electrically inert. This absence of electrical activity can lead to the development of significant Q waves, signifying a completed infarction.
Myocardial Infarction (Myocardial Death): The Irreversible Damage
Myocardial infarction, commonly known as a heart attack, is the death of cardiac muscle cells due to prolonged and severe ischemia. The ECG changes associated with infarction evolve over time, reflecting the progression of pathological processes within the heart muscle.
Early/Acute Infarction (First few hours):
- ST segment elevation: This is the most prominent finding, indicating acute transmural injury.
- Hyperacute T waves: As mentioned, these may precede ST elevation.
- Development of Q waves: As necrosis progresses, the electrically dead tissue results in the formation of pathological Q waves. These are typically defined as Q waves that are at least 0.04 seconds (40 ms) in duration and greater than or equal to one-quarter the amplitude of the R wave in that lead.
Subacute Infarction (Hours to days):
- ST segment elevation begins to resolve: The ST segment gradually returns towards the baseline.
- T wave inversion becomes more pronounced: The inverted T waves become deeper and more symmetrical.
- Q waves become more defined: The Q waves continue to develop and become more prominent.
Chronic Infarction (Days to weeks and beyond):
- ST segment returns to baseline: The ST segment is typically isoelectric.
- Deep and symmetrical T wave inversion persists: Inverted T waves can remain for weeks or months, or sometimes resolve.
- Persistent Q waves: Pathological Q waves usually persist indefinitely, serving as evidence of a previous infarction.
- Loss of R wave progression: In anterior MIs, the normal increase in R wave amplitude across the precordial leads may be lost.
- Possible development of pathological Q waves in septal leads: If the septal leads (e.g., V1-V3) show pathological Q waves, it suggests an anteroseptal infarction.
Specific ECG Patterns and Corresponding Infarct Locations:
The location of myocardial infarction can often be inferred from the specific ECG leads that show abnormalities:
- Anterior Infarction: ST elevation in leads V1-V4, often with Q waves in these leads.
- Septal Infarction: ST elevation in leads V1-V2, often with Q waves in these leads.
- Lateral Infarction: ST elevation in leads I, aVL, and V5-V6, often with Q waves in these leads.
- Inferior Infarction: ST elevation in leads II, III, and aVF, often with reciprocal ST depression in leads I and aVL. Reciprocal changes in inferior MI are particularly common and are an important diagnostic feature.
- Posterior Infarction: Often recognized by reciprocal ST depression in leads V1-V3, with ST elevation potentially visible in posterior leads (V7-V9) if specifically recorded.
Conclusion
The ECG is a dynamic representation of the heart’s electrical activity, and its changes provide invaluable insights into the presence and extent of myocardial ischemia, injury, and infarction. ST segment depression is a hallmark of ischemia, while ST segment elevation signifies acute myocardial injury and is the primary indicator of ST-elevation myocardial infarction (STEMI). The persistent development of Q waves and T wave inversion signifies irreversible myocardial death. Understanding the underlying mechanisms of the “injury current” and its direct impact on the ST segment is fundamental to interpreting these critical ECG findings and guiding prompt, life-saving interventions for patients experiencing acute coronary syndromes. Continuous monitoring and serial ECGs are often necessary to accurately track the evolution of these changes and optimize patient care.

