Vector and the Principles Applied in Plotting Electrical Vector of the Heart
The concept of a vector is fundamental in understanding the electrical activity of the heart. A vector is a mathematical quantity that has both magnitude (size) and direction. In the context of cardiac electrophysiology, vectors are used to represent the electrical forces generated by the depolarization and repolarization of myocardial cells during each heartbeat. These vectors are crucial for interpreting electrocardiograms (ECGs), which provide a graphical representation of the heart’s electrical activity.
What is a Vector in Cardiac Electrophysiology?
In cardiac physiology, an electrical vector represents the direction and strength of electrical activity as it propagates through the heart. The heart’s electrical system generates impulses that travel through specialized conduction pathways, causing coordinated contraction of atrial and ventricular muscle fibers. These impulses create small electric fields, which can be represented as vectors.
- Magnitude: The magnitude of a cardiac vector corresponds to the strength or intensity of the electrical signal at any given moment.
- Direction: The direction indicates where the electrical impulse is traveling within the heart.
For example:
- During depolarization, positive charges move into myocardial cells, creating an electric field with a specific direction.
- During repolarization, ions return to their resting state, generating another set of vectors with different directions.
Principles Applied in Plotting Electrical Vectors of the Heart
Plotting electrical vectors involves understanding how these forces interact spatially and temporally within three-dimensional space. Several principles guide this process:
1. Dipole Concept
The heart’s electrical activity can be modeled as a dipole—a pair of equal but opposite charges separated by some distance. This dipole generates an electric field that can be represented as a vector pointing from negative to positive charge.
- During depolarization, regions ahead of the wavefront are negatively charged (resting state), while regions behind it are positively charged (depolarized). This creates a moving dipole.
- Similarly, during repolarization, areas returning to rest generate another dipole with its own vector.
2. Summation of Vectors
The overall electrical activity at any moment is not due to a single cell but rather millions of myocardial cells acting together. The individual vectors from these cells summate to form a resultant or net vector.
- For example, during ventricular depolarization (QRS complex on an ECG), multiple smaller vectors combine into one large resultant vector that reflects overall ventricular activation.
- This summation explains why certain leads on an ECG show larger deflections than others based on their alignment with this net vector.
3. Three-Dimensional Representation
The heart’s anatomy requires considering its electrical activity in three dimensions:
- The frontal plane (viewed using limb leads I, II, III, AVR, AVL, AVF).
- The horizontal plane (viewed using precordial leads V1-V6).
Each lead records projections or components of these three-dimensional vectors onto its axis:
- Leads aligned with the net vector show larger deflections.
- Leads perpendicular to it show smaller or no deflection.
4. Einthoven’s Triangle and Lead System
Einthoven’s triangle is formed by placing electrodes on both arms and one leg to create three bipolar limb leads (I, II, III). These leads measure voltage differences between two points and help determine:
- The direction (axis) of cardiac vectors.
- The relative magnitude based on lead orientation.
Augmented unipolar limb leads (AVR, AVL, AVF) provide additional perspectives by measuring voltage relative to an average reference point.
5. Cardiac Axis Determination
The mean QRS axis represents the average direction of ventricular depolarization in the frontal plane:
- Normal axis: -30° to +90°.
- Left axis deviation: -30° to -90°.
- Right axis deviation: +90° to +180°. This determination relies on analyzing QRS complexes across multiple leads.
6. Time Dependence
Cardiac vectors change over time during each phase of depolarization and repolarization:
- P wave: Atrial depolarization produces small upward deflections in most leads due to low muscle mass compared to ventricles.
- QRS complex: Ventricular depolarization generates large deflections because ventricles have more muscle mass.
- Early QRS: Depolarization begins at septum; initial vectors point leftward.
- Mid-QRS: Depolarization spreads through ventricles; net vector shifts downward/rightward toward apex.
- Late QRS: Depolarization completes; net vector diminishes as forces cancel out.
- T wave: Ventricular repolarization occurs in reverse order but slower than depolarization; T-wave polarity often matches QRS polarity due to this sequence.
Clinical Applications
Understanding cardiac vectors helps clinicians interpret ECGs for diagnosing various conditions:
- Axis Deviation: Abnormalities like left or right axis deviation suggest underlying issues such as hypertrophy or conduction block.
- Ischemia/Infarction: Changes in ST segments or T waves reflect altered repolarization due to ischemia or infarction.
- Conduction Disorders: Bundle branch blocks alter normal patterns of ventricular activation and thus shift resultant vectors.
Relationship Between Vectors Generated in the Heart and EKG Waves
The heart’s electrical activity generates vectors that represent the direction and magnitude of electrical forces during depolarization and repolarization. These vectors are crucial for understanding the electrocardiogram (EKG or ECG) waves, as they determine the shape, amplitude, and polarity of these waves recorded by electrodes placed on the body surface.
- Depolarizing Signals: Depolarization occurs when cardiac cells transition from a resting state to an activated state, allowing positive ions (primarily sodium) to flow into the cells. This creates a wave of positive charge moving through the myocardium. The vector generated by this wave points in the direction of depolarization.
- When a depolarizing wave moves toward a recording electrode, it produces a positive deflection on the EKG.
- When it moves away from a recording electrode, it results in a negative deflection.
- If the wave is moving perpendicular to an electrode, there is no net deflection (isoelectric line).
- Repolarizing Signals: Repolarization restores cardiac cells to their resting state, primarily involving potassium ion efflux. The vector generated during repolarization points in the opposite direction of depolarization because repolarization occurs from epicardium to endocardium (opposite to depolarization).
- A repolarizing wave moving away from an electrode produces a positive deflection on the EKG.
- A repolarizing wave moving toward an electrode results in a negative deflection.
- Angles to Recording Electrodes:
- The angle between a vector and an electrode determines how much of that vector’s magnitude is recorded as voltage.
- A vector aligned parallel to an electrode axis produces maximum voltage.
- A vector at 90 degrees (perpendicular) produces no voltage.
The relationship between these vectors and EKG waves can be summarized as follows:
- The P wave corresponds to atrial depolarization vectors.
- The QRS complex reflects ventricular depolarization vectors.
- The T wave represents ventricular repolarization vectors.
Concepts of Instantaneous Vectors and Net Vectors
- Instantaneous Vectors: These represent the electrical activity at any single moment during cardiac excitation or recovery. Each instantaneous vector has both magnitude (the strength of electrical activity) and direction (the orientation of electrical flow). For example:
- During ventricular depolarization, instantaneous vectors change dynamically as different regions of the ventricles are activated sequentially.
- Net Vectors: These are summations of all instantaneous vectors at any given time point. They represent the overall direction and magnitude of electrical activity across all myocardial regions at that instant. On an EKG:
- The net vector determines whether there is a positive or negative deflection on specific leads.
- For example, during ventricular depolarization, multiple instantaneous vectors combine into one large net vector pointing toward areas being actively depolarized.
Dissecting a Vector Loop Into Component Instantaneous Vectors
A vector loop represents how net electrical forces change over time during cardiac cycles, such as ventricular depolarization or repolarization. To dissect this loop:
- Identify key phases within one cycle:
- For example, during ventricular depolarization (QRS complex), activation begins at the septum, spreads through both ventricles, and ends at the base of the heart.
- Break down each phase into its corresponding instantaneous vectors:
- Early phase: Small instantaneous vectors originate from septal activation.
- Mid-phase: Larger instantaneous vectors result from simultaneous activation of larger portions of both ventricles.
- Late phase: Smaller instantaneous vectors arise as activation concludes near basal regions.
- Plot these individual instantaneous vectors sequentially:
- Each vector has its own magnitude and direction based on which myocardial region is active at that moment.
- Observe how these individual components form a continuous loop when connected:
- For instance, during QRS complex analysis, early septal activation forms one part of the loop while late basal activation completes it.
Reconstructing a Vector Loop From Individual Traces
To reconstruct a complete vector loop:
- Collect data from multiple leads:
- Use standard limb leads (I, II, III) or augmented leads (aVR, aVL, aVF) to record traces representing projections of cardiac electrical activity along different axes.
- Analyze each lead’s trace for timing and amplitude:
- Determine when specific events like septal or lateral wall activation occur relative to others.
- Translate lead data into spatial information:
- Combine information about amplitudes (magnitude) with lead orientations to calculate corresponding directional components for each event.
- Sequentially plot calculated directional components:
- Start with early events like septal activation and proceed through mid-to-late phases such as lateral wall or basal region activations.
- Connect plotted points smoothly into a closed-loop diagram:
- Ensure continuity between successive phases so that reconstructed loops accurately reflect real-time changes in net electrical forces throughout one cardiac cycle.
For example:
- In normal hearts, reconstructed QRS loops typically show counterclockwise rotation in frontal planes due to orderly progression from septal-to-basal activations within ventricles.
Hexaxial Reference System Generation and Identification of Individual Axes
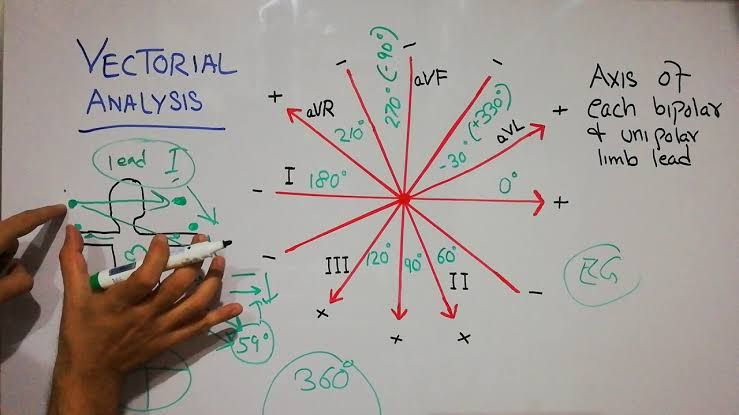
The hexaxial reference system, also known as the Cabrera system, is a method used to represent the electrical axis of the heart in the frontal plane. This system is particularly useful for interpreting electrocardiograms (ECGs) and determining the heart’s electrical axis based on limb leads. The generation of this system involves several key steps:
1. Arrangement of Limb Leads: The first step in generating the hexaxial reference system is to arrange the six limb leads (I, II, III, aVR, aVL, and aVF) in a specific order that facilitates interpretation. The order typically used is:
- aVL
- I
- -aVR (the polarity of lead aVR is reversed)
- II
- aVF
- III
This arrangement allows for an easy visual representation of the axes.
2. Understanding Lead Angles: Each lead corresponds to a specific angle in degrees relative to the horizontal plane:
- Lead I: 0°
- Lead II: +60°
- Lead III: +120°
- Lead aVR: -150° (or +210°)
- Lead aVL: -30°
- Lead aVF: +90°
These angles are crucial for determining the direction of the electrical axis.
3. Identifying Positive Amplitudes: To determine the heart’s electrical axis using this system, one must observe which lead has the highest positive amplitude on an ECG tracing. The direction indicated by this lead represents where the maximal vector points.
4. Locating Isoelectric Leads: Another approach within this system involves identifying which lead is most isoelectric (equiphasic), meaning it has equal positive and negative deflections. Once identified, you can find its corresponding perpendicular lead on the hexaxial reference system.
5. Determining Electrical Axis Direction: Once you have identified either the lead with maximum positive amplitude or located an isoelectric lead, you can determine the heart’s electrical axis:
- If an isoelectric lead is found (e.g., if lead I is equiphasic), look at its perpendicular counterpart (e.g., if lead I is equiphasic, then look at lead II). If lead II shows positive deflection, then you can conclude that the electrical axis points towards approximately +60°.
6. Summary of Individual Axes Identification: Using this method allows for quick identification of various axes:
- Normal Axis: Between -30° and +90°
- Left Axis Deviation (LAD): Between -30° and -90°
- Right Axis Deviation (RAD): Between +90° and +180°
- Extreme Axis Deviation: Between -90° and -180°
By following these steps systematically, one can effectively generate and utilize the hexaxial reference system to interpret ECGs accurately.


